
01
 DagangNews.com
Decoding FTSE BM KLCI: A Year in Review, Future Insights, and Elliott Wave Theory
The FTSE BM KLCI, a cornerstone of the Malaysian stock market, has undergone significant changes in the past year. In this article, it provides a thorough analysis of the FTSE BM KLCI, unravelling its performance, exploring recent trends, and discussing strategies to anticipate its future direction.
Alongside, it also explores Elliott Wave Theory, a tool analysts use to understand market movements. The goal is to methodically analyze the FTSE BM KLCI's historical journey, extracting valuable insights that can shed light on its potential trajectory in the future.
Performance Overview
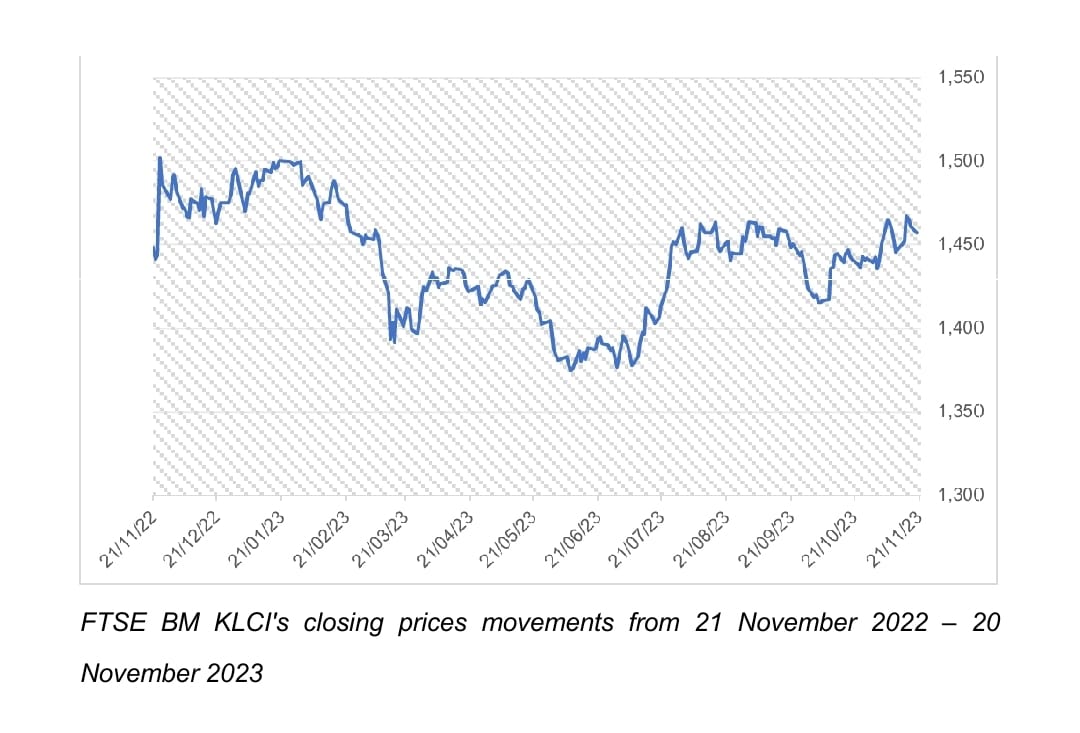
Let's start by checking out how the FTSE BM KLCI has been doing in terms of closing prices. On 21/11/2022, it kicked off around 1,447.96 and hit notable peaks on 24/11/2022, 30/12/2022, and 25/01/2023, reaching its highest point at 1,501.88. These peaks suggest times of increased activity and positive vibes among investors.
But it's not all sunshine; the index also saw some lows, dipping to around 1,400 at various points. These ups and downs tell a story of the market's rhythm, influenced by economic events, global trends, and investor feelings.

Volume Analysis
Trading volumes, or how much buying and selling is going on, can tell us a lot about market health. There was a notable spike in volume on 24/11/2022, matching the peak in closing prices. High volume usually means more people are jumping into the market, showing increased interest during that period.
Throughout the year, trading volumes danced up and down, indicating changes in market activity. Understanding this relationship between price movements and trading volumes is crucial for making smart investment decisions.
Factors at Play
To understand why the FTSE BM KLCI moves the way it does, we need to consider a mix of factors. Economic indicators (like GDP growth rates), geopolitical events (trade tensions, Russo-Ukranian war, conflicts), and central bank decisions on interest rates all play a role. These factors create a dynamic environment, and knowing about them helps make sense of market trends and shifts.
Forecasting the Future
Predicting where the FTSE BM KLCI is headed involves using statistical models. Two common methods are Time Series Analysis (ARIMA) and Machine Learning Models (LSTM). These tools analyze past data to give us a glimpse of potential future trends.
But a word of caution: financial markets are tricky, and these predictions aren't crystal balls. They're more like helpful guides, so always approach them with care.
Elliott Wave Theory Explained
Let's talk about Elliott Wave Theory – a tool that analysts use to predict market moves. Developed in the 1920s and 1930s by Ralph Nelson Elliott, this theory suggests that markets move in patterns that we can recognize and use to our advantage.
Elliott’s Waves
Elliott observed that markets often move in waves rather than straight lines. There's usually an impulsive wave with the trend, followed by a corrective wave against the trend. He identified a five-wave impulsive move followed by a three-wave corrective phase. This pattern repeats on both short-term and longer-term charts.
Elliott Wave Rules
Elliott's theory comes with some rules:
- Wave 2 never goes more than 100% of wave 1.
- Wave 3 can't be the shortest of the three impulse waves.
- Wave 4 doesn't cross the final point of wave 1.
Cycles and Fibonacci
Elliott categorized waves into different cycles, from Grand Supercycle (multi-century) to Sub-Minuette (minutes). And while Elliott didn't specifically use Fibonacci levels, traders often throw them into the mix for added insights.
FTSE BM KLCI 1-Year Analysis and Insight
Now, let's take a closer look at how the FTSE BM KLCI performed over the past year. We'll pay special attention to the highest and lowest closing prices, giving us insights into the market's peaks and troughs throughout the year.
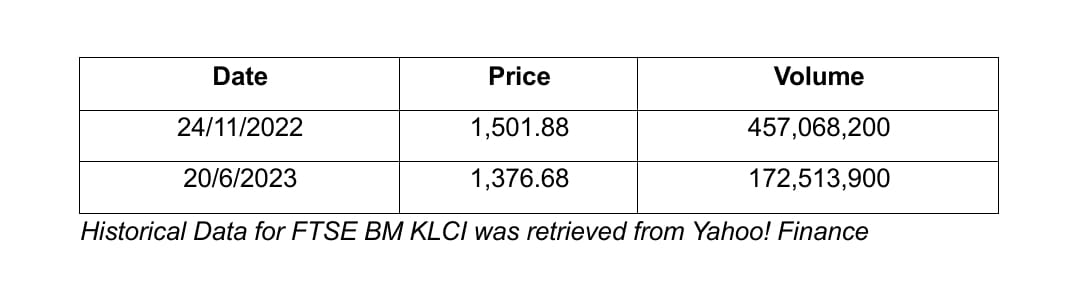
Yearly Peaks, 24/11/2022 - Market Peak
On November 24, 2022, the FTSE BM KLCI reached its pinnacle, closing at an impressive 1,501.88. This marked the highest point in the market for the year, reflecting robust market sentiment and positive investor confidence. The trading volume on this peak day climbed to 457,068,200, indicating a significant uptick in market participation and enthusiasm among investors.
Yearly Troughs, 20/6/2023 - Navigating the Depths
On June 20, 2023, FTSE BM KLCI touched its lowest closing figure at 1,376.68. This trough may be attributed to various economic factors or shifts in investor sentiment. The trading volume during this trough was substantial at 172,513,900, providing insights into the intensity of selling pressure and the level of market interest during this period.
Interpreting Market Dynamics
Examining these peaks and troughs, along with associated trading volumes, provides valuable insights into FTSE BM KLCI's market dynamics. Peaks indicate optimism, while troughs signal challenges or market corrections. These extremes help analysts and investors gauge the overall health of the market.
Analyzing Trends
The FTSE BM KLCI's journey over the past year, when synced with Elliott Waves, reveals some interesting connections. Peaks and troughs in closing prices align with impulsive and corrective waves, showing that Elliott's theory could have its fingerprints on the market's moves.
Crafting a Thoughtful Approach to Navigate the FTSE BM KLCI's Dynamic Landscape
Simply put, the FTSE BM KLCI's journey unfolds through a blend of economic forces, global events, and trader behaviour. Employing tools like Elliott Wave Theory and advanced models helps decode market patterns. However, it's crucial to grasp the unpredictable nature of markets.
Navigating the FTSE BM KLCI demands a thoughtful approach. Decisions should balance thorough information, prudent caution, and a focus on the long term. In this dynamic landscape, success lies in a strategy that combines data-driven insights with an awareness of financial uncertainties. - DagangNews.com
Wan Mohd Farid Wan Zakaria adalah Pensyarah Kanan Fakulti Pengurusan & Perniagaan UiTM Cawangan Johor, Kampus Segamat.
KLIK DI SINI UNTUK KOLEKSI ARTIKEL EKSPONEN